Comparison prompts: win rate and criteria
Comparison prompts ask an AI to choose between you and named rivals. Their report is the richest in the product, and the most useful for competitive positioning.
Every number here is measured over judged runs: runs where the AI judge successfully returned a ranking. Runs where the judge failed are excluded entirely rather than counted as losses.
How a win is decided
The judge names a winner for each run. When it says "tied", we do not throw the run away. We look at the brands sharing first place and break the tie in order:
- Who won more of the named criteria? The judge lists up to 8 comparison criteria per run, each with its own winner.
- If still level, who has the higher sentiment in that answer?
- Only if both are identical does the run stay genuinely tied, counting for nobody.
This matters more than it sounds. Roughly a third of comparison runs come back nominally tied, and treating every one as a loss would drag win rates far below reality.
The four cards
| Card | What it measures |
|---|---|
| Win rate | Judged runs where you were picked, over all judged runs |
| Podium rate | Judged runs where you placed 1st, 2nd or 3rd |
| Loss rate | 100% minus win rate, so it includes tied runs |
| Sentiment | Your average tone score, shown against the field average |
Podium rate only appears when four or more brands are being compared. With two or three, everyone is automatically in the top three, so the number would be meaningless.
The sentiment card is coloured by the gap to the field average, not by the raw score. A +0.71 against a field averaging +0.62 is good news: the AI is more positive about you than about the category as a whole.
Pick distribution
The donut shows each brand's share of all judged runs, plus a "Tied / no clear pick" row for the remainder.
Tied = 100 - (sum of every brand's share)With 18 judged runs where you won 11 and a rival won 6, you show 61%, they show 33%, and 6% ended tied.
The brand strip
A card per brand, sorted by win rate. Four numbers sit on each one.
| Northwind (you) | Acme | |
|---|---|---|
| Win rate | 61% | 33% |
| Sentiment | +0.71 | +0.53 |
| Picked #1 | 11x | 6x |
| Criteria won | 62 · 57% | 47 · 43% |
Picked #1 is the raw count of answers naming that brand the top pick. It is exactly the top of the win rate fraction: 11 picks out of 18 judged runs is the 61% above it.
Criteria won carries two numbers. The first is how many individual criteria that brand won, added across every judged run. Since each run contributes up to 8 criteria, this count is normally much larger than the run count. The second is that brand's share of all criteria that had a clear winner:
                  criteria this brand won
Criteria share =  ------------------------  x 100
                  all criteria that had a
                     clear winner
Why criteria share is worth watching
Take a different prompt, where a brand won 100% of the overall picks, 15 out of 15. On criteria, it won 47 while its rival won 50 - so the rival actually took 52% of the individual feature battles.
Read together, those two numbers tell a real story: the AI consistently recommends you overall, but rates your rival better on more individual dimensions. That is a fragile lead, and the criteria table below is where you find out which dimensions are at risk.
Who AI picks, by criterion
The top 10 criteria, ordered by how often they came up.
| Criterion | Winner | You | Rival | Mentions |
|---|---|---|---|---|
| integrations | Bluebird | 0% | 100% | 7x |
| reporting depth | Northwind | 100% | 0% | 4x |
| ease of setup | Bluebird | 0% | 100% | 4x |
| template library | Northwind | 100% | 0% | 3x |
| roadmap planning | Northwind | 100% | 0% | 3x |
| onboarding flow | Bluebird | 0% | 100% | 3x |
The Mentions column is the denominator for that row. A criterion raised in only 3 of 18 runs still shows its percentages out of 3, which is why narrow rows often read as a clean 100%. Grey space in the bar is criteria the judge marked tied.
This table converts directly into a content brief. In the example above, you own depth and planning, while the rival owns setup, onboarding and integrations. Those three are exactly where the AI is choosing them over you.
Head-to-head and per-model verdicts
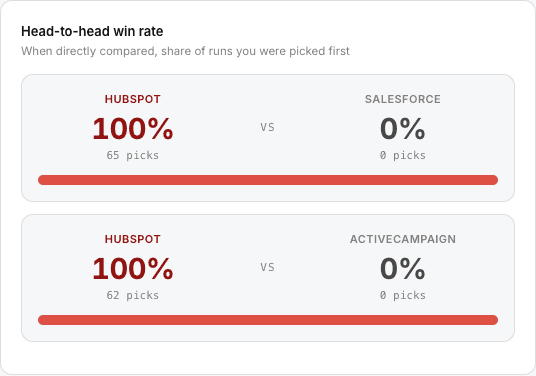
Head-to-head compares you against one rival at a time, using only the runs where the judge ranked both of you. Ties are excluded, which is what keeps the two sides totalling a clean 100%.
Watch the sample size. A 100% from 4 compared runs is far weaker evidence than a 69% from 16.
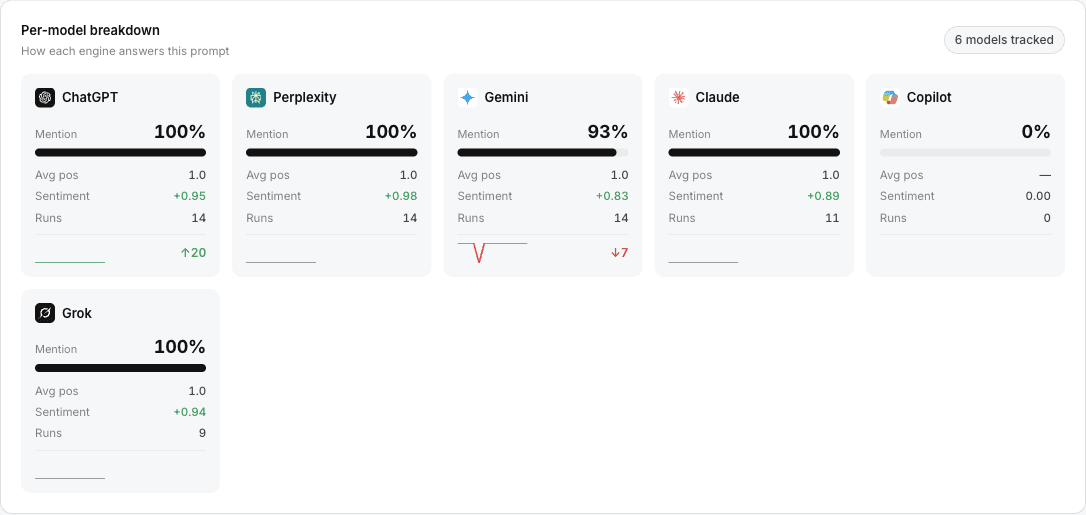
The per-model cards break the same verdict down by engine. Each shows your share, the strongest rival on that engine, a grey remainder for everyone else plus ties, and the run count. Engines with no runs show a dash rather than 0%, so an untested engine is not mistaken for a failure.